Student Proficiency in Reading, Math, and Science
- Among fourth graders, 31% of students demonstrated reading skills at or above the proficient level in 2024, while 40% displayed below-basic skills (Indicator I-02a).
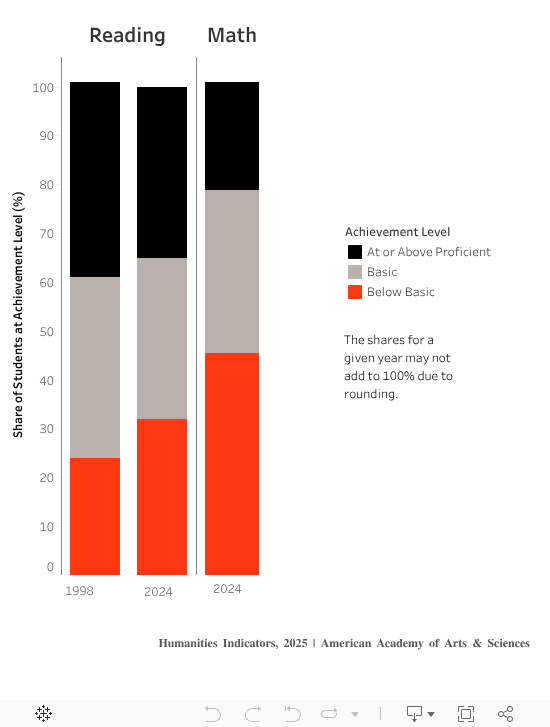
- Fourth and eighth graders were similar as far as the share of students demonstrating at least proficiency on the reading assessment in 2024, while the share of high school seniors at that achievement level was somewhat greater (Indicators I-02b and I-02c). Fourth graders were more likely than the older students to score at the below-basic level.
- In 2024, fourth-grade students performed markedly better on the math assessment than the reading test, with a larger share demonstrating at least proficiency (39% for math compared with 31% for reading) and a substantially smaller share scoring at the below-basic level (24% for math compared with 40% for reading).
- Among eighth graders, the results of the 2024 reading, math, and science assessments were similar with respect to the share of students demonstrating proficiency. Fewer students demonstrated below-basic achievement on the reading exam than on the other two assessments.
- At the 12th-grade level, students performed markedly better in reading than in math in 2024.
- Among fourth graders, the percentages of students scoring at the proficient level or higher on the reading assessment were nearly identical in 1996 and 2024, while math scores shot up by 18 percentage points between the two years.
- Among eighth graders, the share of students demonstrating below-basic proficiency on the reading exam increased from 1998 to 2024, while the proportion was relatively stable on the math exam.
Among 12th graders, reading achievement declined from 1998 to 2024, with the share of students scoring at the below-basic level increasing and the percentage demonstrating proficiency shrinking.
Looking the short-term trend, reading achievement declined at all three grade levels on the two assessments preceding the 2024 round (administered in 2019 and 2022; not pictured). Visit the NAEP website for more information on the short-term trends at the and -grade levels.
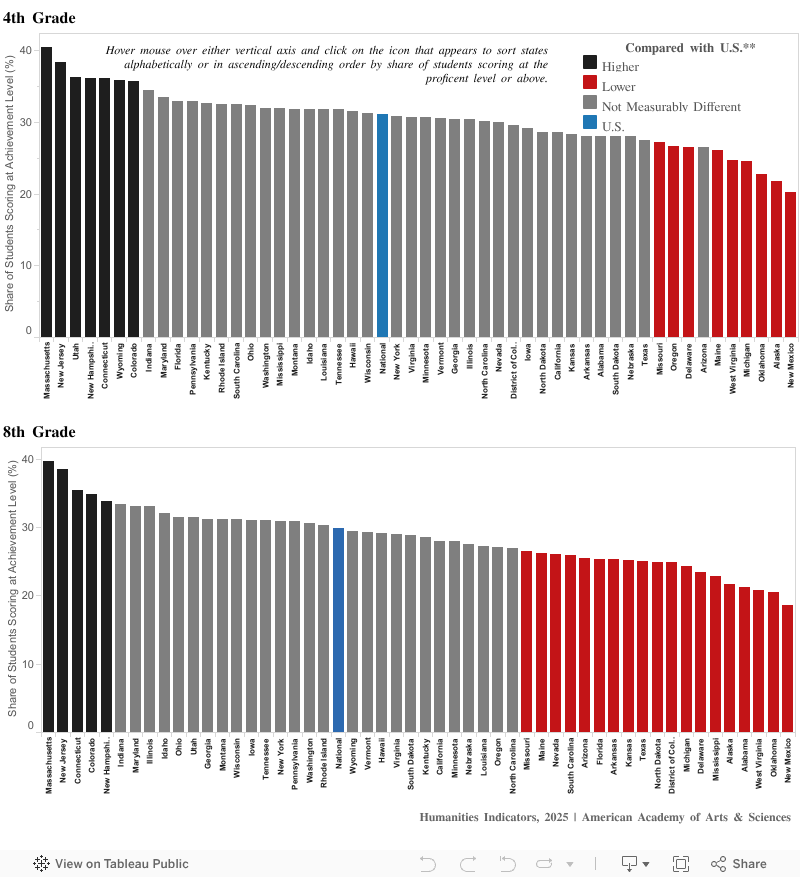
- Dynamic data visualization I-02d allows users to compare states and the District of Columbia according to the share of fourth- and eighth-grade students who demonstrated reading proficiency on the 2024 NAEP reading assessment (state-level data are not available for 12th graders). The color coding indicates whether a state’s share was measurably higher or lower than the share for the nation as a whole.1 Though states of the same color may have different size shares, the difference between them may not be statistically significant.
- On the fourth-grade exam, Massachusetts had the greatest share of students performing at or above the proficient level, though it’s share was not measurably larger than several other states with substantial percentages of high-performing students (New Jersey, Utah, New Hampshire, Connecticut, Wyoming, and Colorado). New Mexico had the smallest share of such students (though the difference between New Mexico’s share and those of Alaska, Oklahoma, and Michigan was not statistically significant).
- On the eighth-grade exam, Massachusetts, New Jersey, Connecticut, and Colorado had the largest observed shares of students performing at this level (their estimated shares of proficient students were statistically indistinguishable). New Mexico had the smallest share, though it was not measurably different from the shares for Oklahoma, West Virginia, Alabama, Alaska, and Mississippi.
I-02a: Fourth Graders’ Performance on the National Assessment of Educational Progress (NAEP),* by Subject, 1996/1998–2024
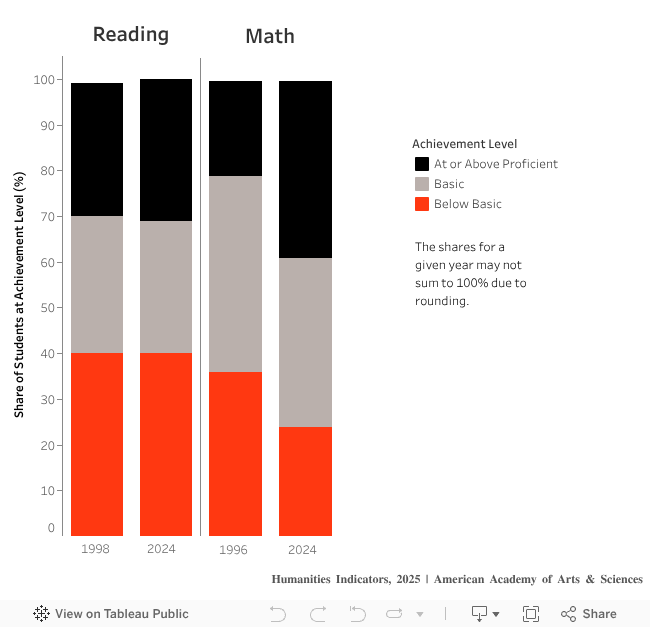
* Main NAEP assessment. See “About the Data” for details.
Source: U.S. Department of Education, Institute of Education Sciences, National Center for Education Statistics, National Assessment of Educational Progress. Data analyzed and presented by the American ÇďżűĘÓƵ of Arts and Sciences’ Humanities Indicators ().
The National Assessment of Educational Progress (NAEP) includes two assessments in reading. One of these is specifically designed to generate and has remained essentially unchanged since it was first given to students in 1971. The other, referred to as the and the basis of this indicator, changes in response to current educational practices and curricula. (For a detailed comparison of the two assessments, see .)
According to the National Center for Educational Statistics, the federal agency responsible for administering the NAEP, the main NAEP reading assessment “measures a range of reading skills, from identifying explicitly stated information, to making complex inferences about themes, to comparing multiple texts on a variety of dimensions.”
A score at the “basic” level indicates that a student has demonstrated partial mastery of prerequisite knowledge and skills that are fundamental for proficient work at each grade. A score of “proficient” indicates solid academic performance: Students reaching this level have demonstrated competency with challenging subject matter. An “advanced” score represents superior performance. These achievement scales are grade specific. Thus, for example, a child scoring at the “advanced” achievement level on the 12th-grade exam in a given subject area has demonstrated different skills than a fourth grader scoring at the “advanced” level. (See for a description of the skills associated with each achievement level.)
The (NDE) permits analysis of both the long-term trend and main NAEP data sets by gender, ethnicity, and other key variables. With NDE one can also obtain results of recent reading assessments for individual states and compare these with student outcomes in other parts of the country.
I-02b: Eighth Graders’ Performance on the National Assessment of Educational Progress (NAEP),* by Subject, 1996/1998–2024
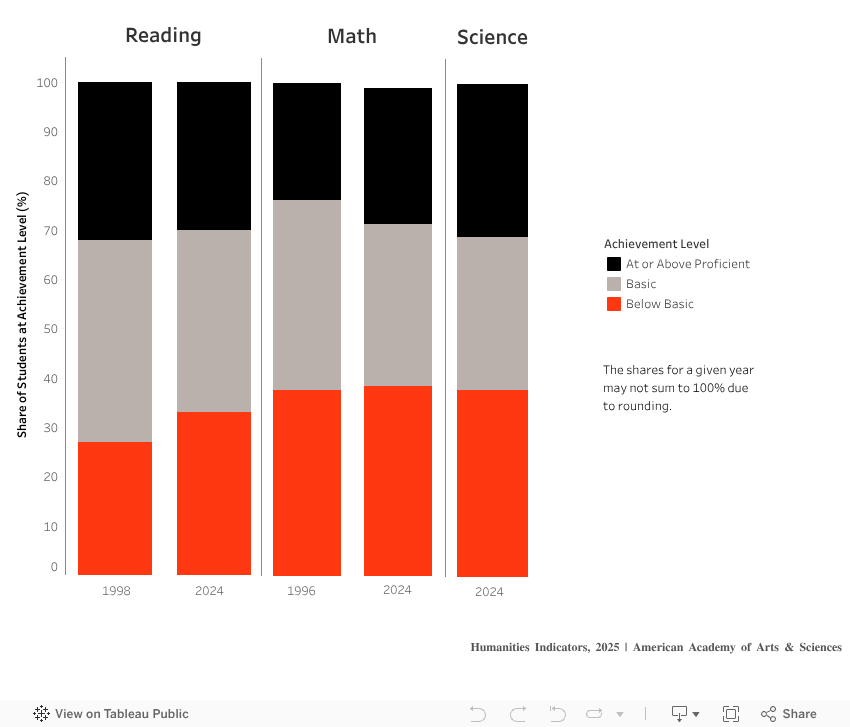
* Main NAEP assessment. See “About the Data” for details.
Source: U.S. Department of Education, Institute of Education Sciences, National Center for Education Statistics, National Assessment of Educational Progress. Data analyzed and presented by the American ÇďżűĘÓƵ of Arts and Sciences’ Humanities Indicators ().
The National Assessment of Educational Progress (NAEP) includes two assessments in reading. One of these is specifically designed to generate and has remained essentially unchanged since it was first given to students in 1971. The other, referred to as the and the basis of this indicator, changes in response to current educational practices and curricula. (For a detailed comparison of the two assessments, see .)
According to the National Center for Educational Statistics, the federal agency responsible for administering the NAEP, the main NAEP reading assessment “measures a range of reading skills, from identifying explicitly stated information, to making complex inferences about themes, to comparing multiple texts on a variety of dimensions.”
A score at the “basic” level indicates that a student has demonstrated partial mastery of prerequisite knowledge and skills that are fundamental for proficient work at each grade. A score of “proficient” indicates solid academic performance: Students reaching this level have demonstrated competency with challenging subject matter. An “advanced” score represents superior performance. These achievement scales are grade specific. Thus, for example, a child scoring at the “advanced” achievement level on the 12th-grade exam in a given subject area has demonstrated different skills than a fourth grader scoring at the “advanced” level. (See for a description of the skills associated with each achievement level.)
The (NDE) permits analysis of both the long-term trend and main NAEP data sets by gender, ethnicity, and other key variables. With NDE one can also obtain results of recent reading assessments for individual states and compare these with student outcomes in other parts of the country.
I-02c: 12th Graders’ Performance on the National Assessment of Educational Progress (NAEP),* by Subject, 1998–2024
* Main NAEP assessment. See “About the Data” for details.
Source: U.S. Department of Education, Institute of Education Sciences, National Center for Education Statistics, National Assessment of Educational Progress. Data analyzed and presented by the American ÇďżűĘÓƵ of Arts and Sciences’ Humanities Indicators ().
The National Assessment of Educational Progress (NAEP) includes two assessments in reading. One of these is specifically designed to generate and has remained essentially unchanged since it was first given to students in 1971. The other, referred to as the and the basis of this indicator, changes in response to current educational practices and curricula. (For a detailed comparison of the two assessments, see .)
According to the National Center for Educational Statistics, the federal agency responsible for administering the NAEP, the main NAEP reading assessment “measures a range of reading skills, from identifying explicitly stated information, to making complex inferences about themes, to comparing multiple texts on a variety of dimensions.”
A score at the “basic” level indicates that a student has demonstrated partial mastery of prerequisite knowledge and skills that are fundamental for proficient work at each grade. A score of “proficient” indicates solid academic performance: Students reaching this level have demonstrated competency with challenging subject matter. An “advanced” score represents superior performance. These achievement scales are grade specific. Thus, for example, a child scoring at the “advanced” achievement level on the 12th-grade exam in a given subject area has demonstrated different skills than a fourth grader scoring at the “advanced” level. (See for a description of the skills associated with each achievement level.)
The (NDE) permits analysis of both the long-term trend and main NAEP data sets by gender, ethnicity, and other key variables. With NDE one can also obtain results of recent reading assessments for individual states and compare these with student outcomes in other parts of the country.
I-02d: Share of Fourth and Eighth Graders Scoring at the “Proficient” Level or Above on the National Assessment of Educational Progress (NAEP),* by State, 2024
* Main assessment. See “About the Data” for details.
** Noted differences are statistically significant at the 5% level. Not all differences in shares among states within a given comparison category are statistically significant.
Source: U.S. Department of Education, Institute of Education Sciences, National Center for Education Statistics, National Assessment of Educational Progress. Data analyzed and presented by the American ÇďżűĘÓƵ of Arts and Sciences’ Humanities Indicators ().
The National Assessment of Educational Progress (NAEP) includes two assessments in reading. One of these is specifically designed to generate and has remained essentially unchanged since it was first given to students in 1971. The other, referred to as the and the basis of this indicator, changes in response to current educational practices and curricula. (For a detailed comparison of the two assessments, see .)
According to the National Center for Educational Statistics, the federal agency responsible for administering the NAEP, the main NAEP reading assessment “measures a range of reading skills, from identifying explicitly stated information, to making complex inferences about themes, to comparing multiple texts on a variety of dimensions.”
A score at the “basic” level indicates that a student has demonstrated partial mastery of prerequisite knowledge and skills that are fundamental for proficient work at each grade. A score of “proficient” indicates solid academic performance: Students reaching this level have demonstrated competency with challenging subject matter. An “advanced” score represents superior performance. These achievement scales are grade specific. Thus, for example, a child scoring at the “advanced” achievement level on the 12th-grade exam in a given subject area has demonstrated different skills than a fourth grader scoring at the “advanced” level. (See for a description of the skills associated with each achievement level.)
The (NDE) permits analysis of both the long-term trend and main NAEP data sets by gender, ethnicity, and other key variables. With NDE one can also obtain results of recent reading assessments for individual states and compare these with student outcomes in other parts of the country.
